Serial and debugging
You must have met similar situations: your code is downloaded to the board but doesn't work as you have predicted; even if you press the reset button, the board is still unresponsive. You are unable to see what is happening inside your device, so at that time, you need to debug your code.
There are two common ways. One is to step through it, which is not supported yet. So the best way now is to print the information out to find the problem.
Let's see how you use the Serial Monitor to view the output. It is installed when you install the MadMachine for VS code. And if you want another serial software, we find Serial Studio works well.
Step 1: Add print() in your code
Add the function print() to print all values out in case of any unexpected mistakes. There are so many possibilities. Only in this way do you know which step goes wrong.
After finishing the code, download the code to your board.
Step 2: Connect the board to your computer
Now connect the board to your computer through the port. On SwiftIO Micro, the port is not only for downloading code but also for serial communication between your board and computer. The microcontrollers use serial communication, but your computer hardly uses it, so a USB-Serial converter is added to the board to allow data transmission.
Step 3: Connect the serial port
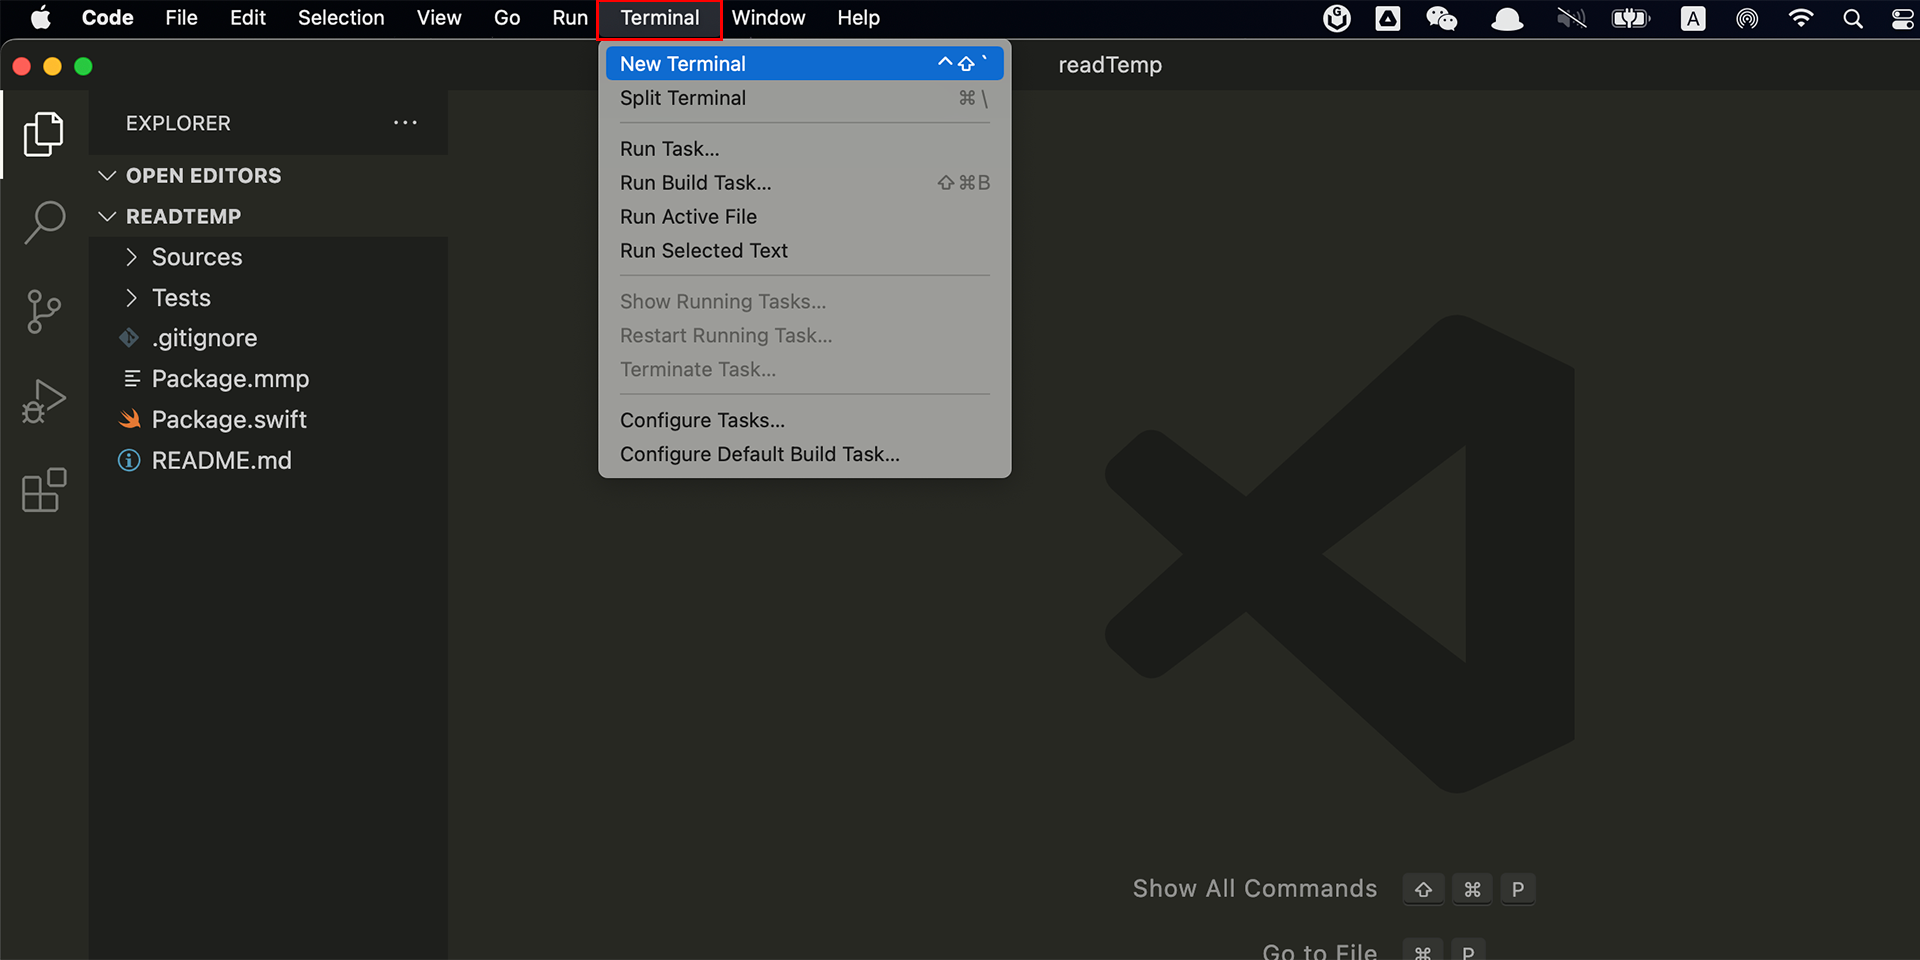
- If the terminal window doesn't show in VS code, open it by clicking Terminal / New Terminal.

- Click SERIAL MONITOR tab. You will see all settings for the serial port.

- Click on the Port dropdown to choose the port of your board. Its name should start with tty.wchusbserial.

- Click on the Baud rate dropdown and select 115200.

- Click the button Start Monitoring. The values will then be printed on the window.

Failed to open the serial port on Linux.
That may be due to your user not being a member of the dialout group.
- Print the groups for your user:
group username
- If dialout isn't in it, add the user to the group with sudo permission:
sudo adduser username dialout
Now the serial monitor should be opened successfully.
Step 4: View values
Press the reset button on your board to restart the code. When the code runs again, you can check the values on the output window. According to the printed values, you can infer which line of code is not executed or has an error by mistake.