LCD display
Get ready to bring your projects to life with the power of LCD displays! With their ability to display everything from simple text to complex graphics, LCDs are an essential tool in various electronic projects. In this tutorial, let's dive into the process of working with LCDs. You'll find how easy and fun it can be.
Learning goals
- Get a general idea of SPI communication.
- Understand the coordinate system and pixels of LCDs.
- Know more about color: RGB color model, color depth.
- Learn about vector and raster images.
- Learn to draw simple graphics on LCDs.
🔸Circuit - LCD
| LCD Pin | SPI (SCK) | SPI (SDI) | BL | RST | DC | CS |
|---|---|---|---|---|---|---|
| SwiftIO Micro Pin | SPI0 (SCK0) | SPI0 (SDO0) | D2 | D3 | D4 | D5 |
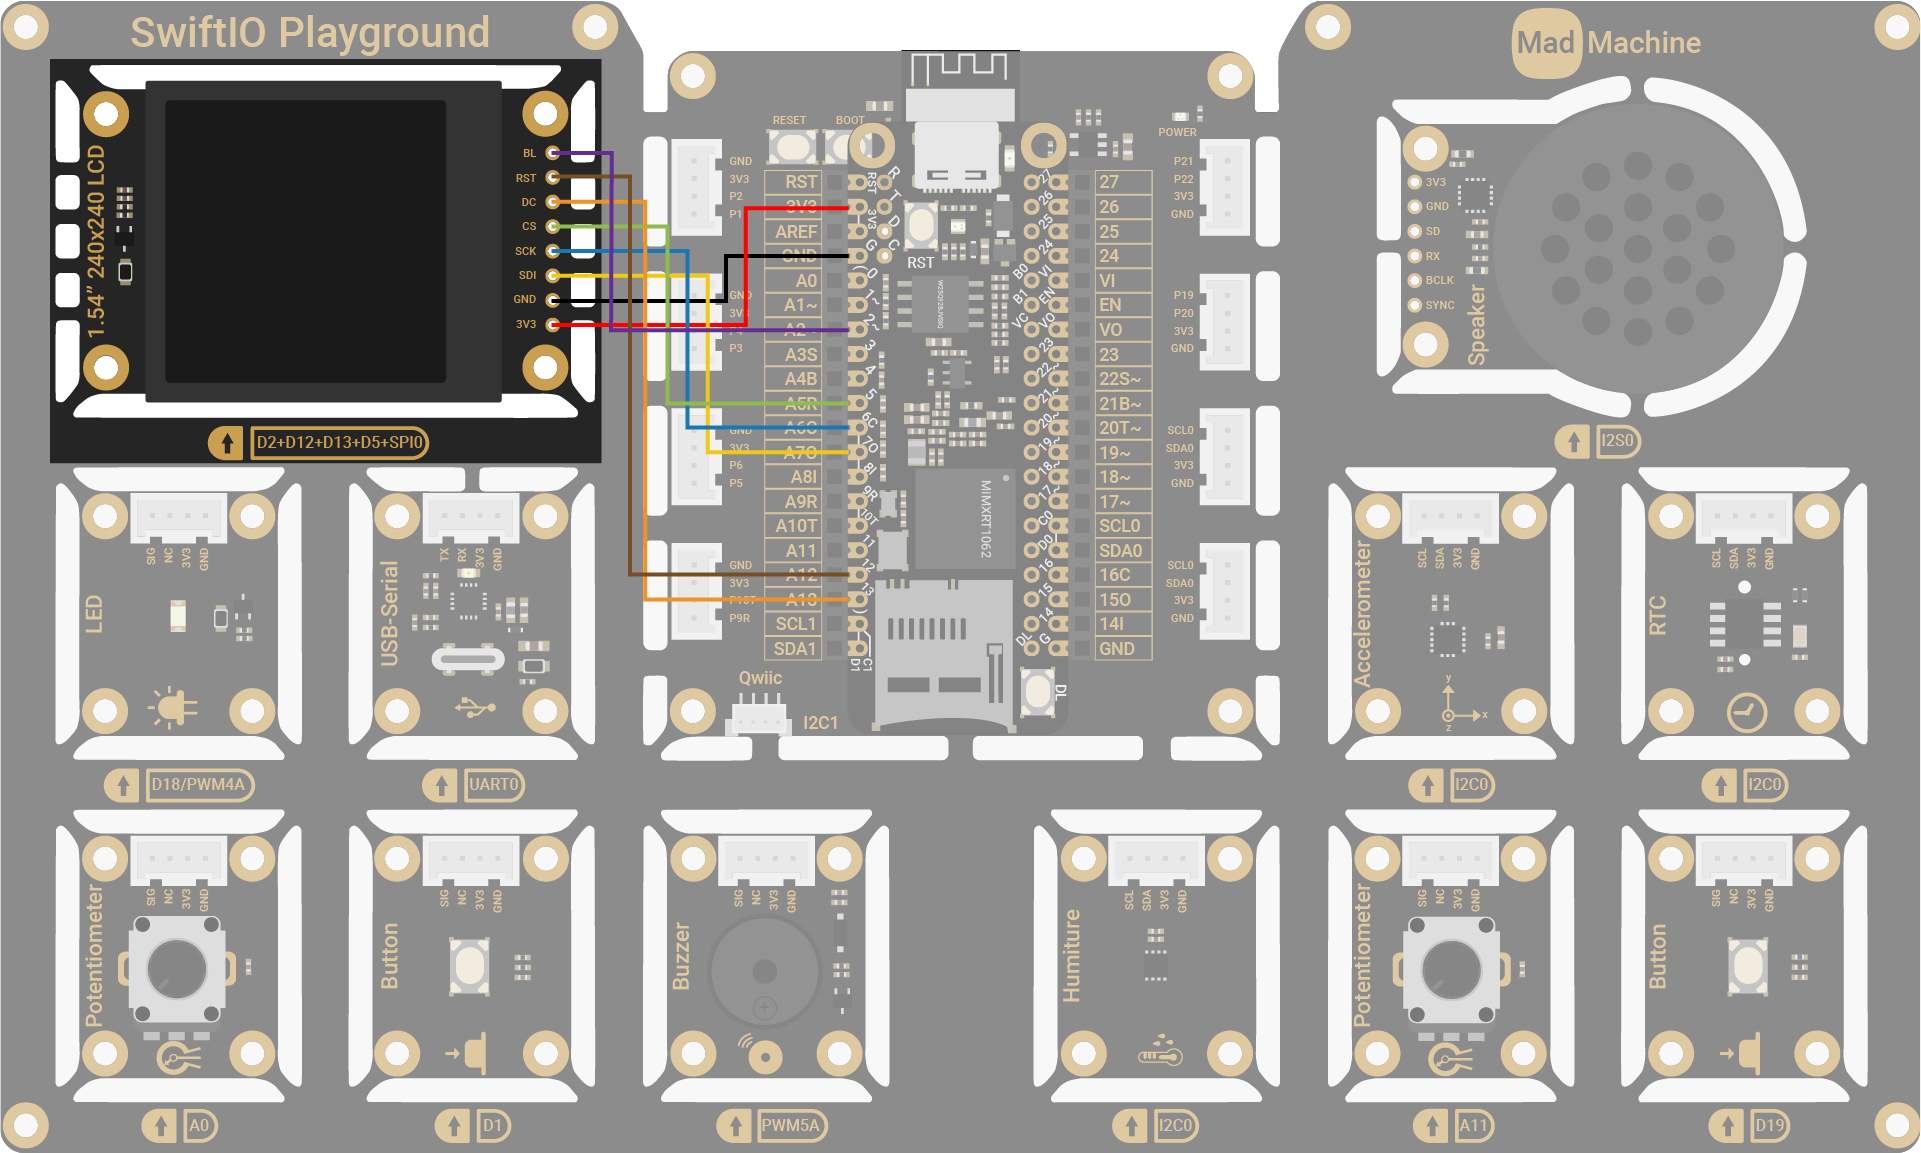
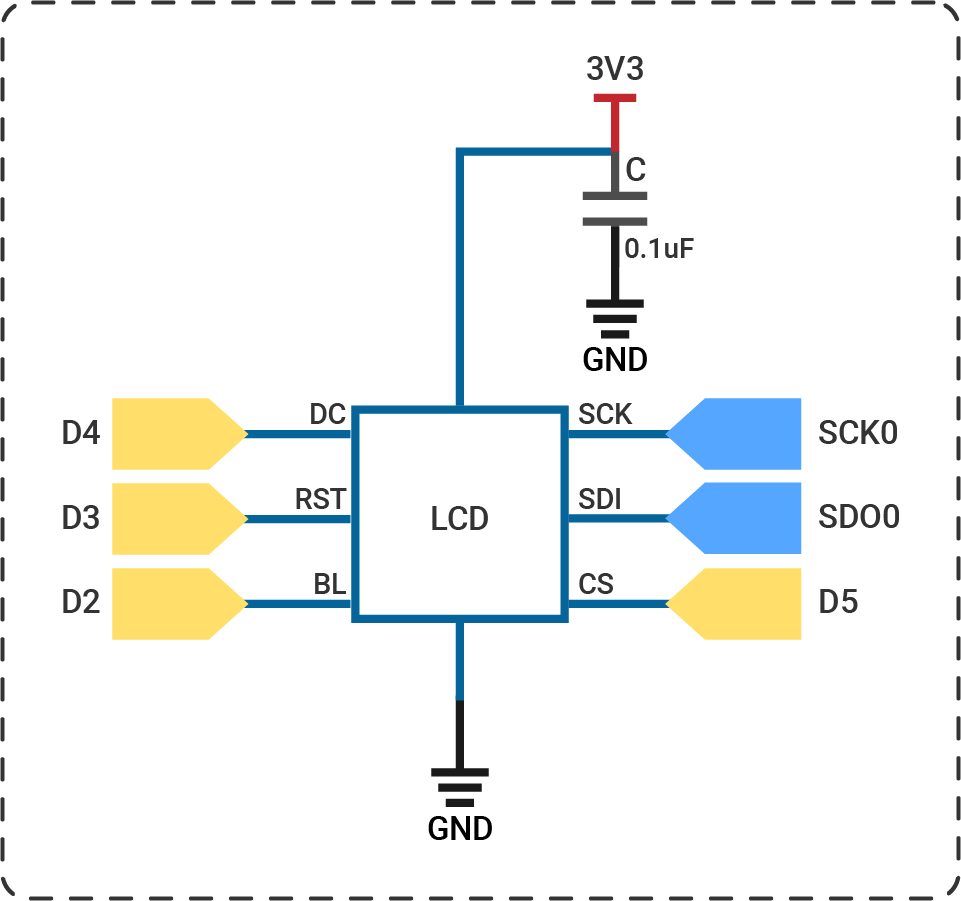
The circuits above are simplified versions for your reference. Download the schematics here.
🔸Projects
1. LCD display
You are going to use the library ST7789 to paint the screen and show some simple animation on it.
Project overview
- Fill the screen in red, then green, blue, white, and black.
- Draw a red horizontal line every 10 rows.
- Draw a blue vertical line every 10 columns.
- Fill the screen in black to clear the screen.
- Draw red, green, blue and white squares one by one repeatedly.
Example code
You can download the project source code here.
- main.swift
- Package.swift
// Import SwiftIO to set the communication and MadBoard to use pin id.
import SwiftIO
import MadBoard
// Import the library to configure the LCD and write pixels on it.
import ST7789


// Initialize the SPI pin and the digital pins for the LCD.
let bl = DigitalOut(Id.D2)
let rst = DigitalOut(Id.D12)
let dc = DigitalOut(Id.D13)
let cs = DigitalOut(Id.D5)
let spi = SPI(Id.SPI0, speed: 30_000_000)

// Initialize the LCD using the pins above. Rotate the screen to keep the original at the upper left.
let screen = ST7789(spi: spi, cs: cs, dc: dc, rst: rst, bl: bl, rotation: .angle90)

// Store some color values for easier reference later.
let black = UInt16(0x0000).byteSwapped
let red   = UInt16(0xF800).byteSwapped
let green = UInt16(0x07E0).byteSwapped
let blue = UInt16(0x001F).byteSwapped
let white = UInt16(0xFFFF).byteSwapped

// Fill the whole screen with red, green, blue, white, and black in turns.
// The color changes every second.
screen.clearScreen(red)
sleep(ms: 1000)

screen.clearScreen(green)
sleep(ms: 1000)

screen.clearScreen(blue)
sleep(ms: 1000)

screen.clearScreen(white)
sleep(ms: 1000)

screen.clearScreen(black)
sleep(ms: 1000)

// Draw red horizontal lines every 10 rows, so the lines will be on rows 0, 10, 20, ..., 230.
for y in stride(from: 0, to: screen.height, by: 10) {
    for x in 0..<screen.width {
        screen.writePixel(x: x, y: y, color: red)
    }
}
sleep(ms: 1000)

// Draw blue vertical lines every 10 columns, so the lines will be on columns 0, 10, 20, ..., 230.
for x in stride(from: 0, to: screen.width, by: 10) {
    for y in 0..<screen.height {
        screen.writePixel(x: x, y: y, color: blue)
    }
}
sleep(ms: 1000)

// Paint the screen black to erase all stuff on it.
screen.clearScreen(black)
sleep(ms: 1000)

// Store the colors of four squares for later use.
let colors = [red, green, blue, white]

// Set the size of the square.
let width = 80

// First, draw a 80x80 red square from the origin.
// After one second, draw a green one from the centre of the red square.
// The blue and white ones are similar.
while true {
    var x = 0, y = 0

    for color in colors {
        fillSquare(x: x, y: y, width: width, color: color)
        x += width / 2
        y += width / 2
        sleep(ms: 1000)
    }
}

// This function allows you to draw a square on the LCD from the point (x,y).
func fillSquare(x: Int, y: Int, width: Int, color: UInt16) {
    for px in y..<(y + width) {
        for py in x..<(x + width) {
            screen.writePixel(x: px, y: py, color: color)
        }
    }
}
// swift-tools-version: 5.9
// The swift-tools-version declares the minimum version of Swift required to build this package.

import PackageDescription

let package = Package(
    name: "LCD",
    dependencies: [
        // Dependencies declare other packages that this package depends on.
        .package(url: "https://github.com/madmachineio/SwiftIO.git", branch: "main"),
        .package(url: "https://github.com/madmachineio/MadBoards.git", branch: "main"),
        .package(url: "https://github.com/madmachineio/MadDrivers.git", branch: "main"),
    ],
    targets: [
        // Targets are the basic building blocks of a package, defining a module or a test suite.
        // Targets can depend on other targets in this package and products from dependencies.
        .executableTarget(
            name: "LCD",
            dependencies: [
                "SwiftIO",
                "MadBoards",
                // Use specific library name rather than "MadDrivers" would speed up the build procedure.
                .product(name: "ST7789", package: "MadDrivers"),
            ]),
    ]
)
Code analysis
let spi = SPI(Id.SPI0, speed: 30_000_000)
The LCD needs quite a lot of data for display, so the SPI speed needs to be fast enough to get a better view. And the Micro support 30MHz SPI speed at most.
The CS pin is not set when initializing the SPI, so it needs to be set when initializing the screen.
let screen = ST7789(spi: spi, cs: cs, dc: dc, rst: rst, bl: bl, rotation: .angle90)
This statement initializes the LCD. It needs several parameters:
- at first, the pins used for SPI communication: an SPI interface and a CS pin.
- digital pins for LCD configuration.
- then the size of the screen: width and height. The chip ST7789 supports screens of different sizes. The default size is 240x240.
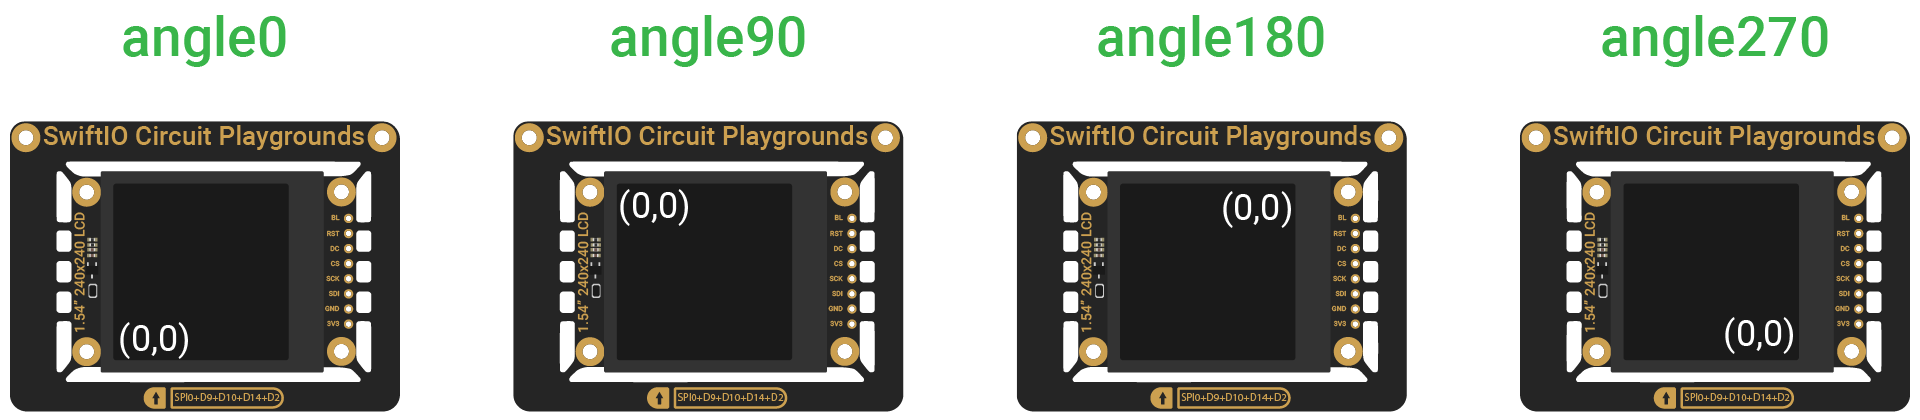
- at last, the rotation of the screen. The screen rotates by 90 degrees when designing the circuit. So you could set it to
.angle90to move the origin to the upper left corner.
for y in stride(from: 0, to: screen.height, by: 10) {
    for x in 0..<screen.width {
        screen.writePixel(x: x, y: y, color: red)
    }
}
The function stride(from:to:by:) makes y start from 0, increased by 10 each time. The maximum value is 240 but is not included, so y is 230 at most. The value for x is 0, 1 ... 238, 239.
Here two for-in loops are used to set corresponding pixels in red one by one.
- At first, the pixels from (0,0), (10,0) to (239,0) are set, which forms a horizontal line.
- Then the pixels (0, 10) to (239, 10)...
func fillSquare(x: Int, y: Int, width: Int, color: UInt16) {
    for px in y..<(y + width) {
        for py in x..<(x + width) {
            screen.writePixel(x: px, y: py, color: color)
        }
    }
}
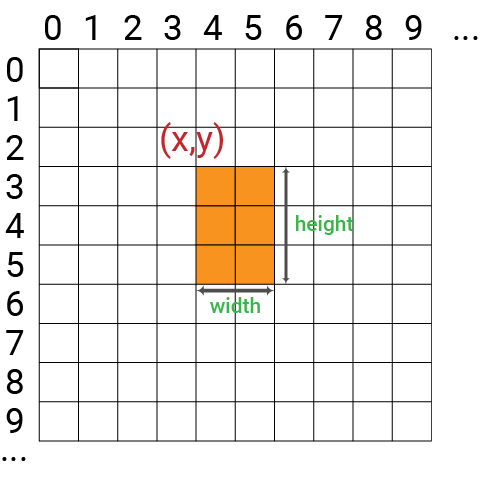
This function fills an area (rectangle or square) of pixels with the same color. For example, in the image below, the pixels are set in order: (4,3), (5,3), (4,4), (5,4), (4,5), (5,5).
If you change the order of two loops, the pixel order will change accordingly: (4,3), (4,4), (4,5), (5,3), (5,4), (5,5). However, you cannot perceive this change as the speed is so fast.
for color in colors {
    fillSquare(x: x, y: y, width: width, color: color)
    x += width / 2
    y += width / 2
    sleep(ms: 1000)
}
In the loop, squares of the same size will show on the screen: red square starts from (0,0), green one from (40,40), blue one from (80,80), white one from (120,120).
After this loop is finished, x and y equal 0 again, and then the animation repeats.
2. Rainbow
Fill the screen with rainbow colors.
Project overview
- Draw a red rectangle.
- Then draw an orange one beside it.
- Similarly, draw rectangles using other rainbow colors.
- Clear the screen and redraw them on the screen.
Example code
You can download the project source code here.
- main.swift
- Package.swift
// Fill the screen with rainbow colors.

import SwiftIO
import MadBoard
import ST7789


// Initialize the SPI pin and the digital pins for the LCD.
let bl = DigitalOut(Id.D2)
let rst = DigitalOut(Id.D12)
let dc = DigitalOut(Id.D13)
let cs = DigitalOut(Id.D5)
let spi = SPI(Id.SPI0, speed: 30_000_000)

// Initialize the LCD using the pins above. Rotate the screen to keep the original at the upper left.
let screen = ST7789(spi: spi, cs: cs, dc: dc, rst: rst, bl: bl, rotation: .angle90)

let red: UInt32 = 0xFF0000
let orange: UInt32 = 0xFF7F00
let yellow: UInt32 = 0xFFFF00
let green: UInt32 = 0x00FF00
let blue: UInt32 = 0x0000FF
let indigo: UInt32 = 0x4B0082
let violet: UInt32 = 0x9400D3
let colors888 = [red, orange, yellow, green, blue, indigo, violet]
// Get 16bit color data.
let colors565: [UInt16] = colors888.map { getRGB565BE($0) }

// The width for each color bar.
let width = screen.width / colors565.count

while true {
    // Use 7 colors in order to draw rectangles on display.
    for i in colors565.indices {
        for y in 0..<screen.height {
            for x in (width*i)..<(width*(i+1)) {
                screen.writePixel(x: x, y: y, color: colors565[i])
            }
        }
    }

    sleep(ms: 1000)
    // Fill the display with black.
    screen.clearScreen(0)
}

// The screen needs RGB565 color data, so change color data from UInt32 to UInt16.
// Besides, the board uses little endian format, so the bytes are swapped.
func getRGB565BE(_ color: UInt32) -> UInt16 {
    return UInt16(((color & 0xF80000) >> 8) | ((color & 0xFC00) >> 5) | ((color & 0xF8) >> 3)).byteSwapped
}
// swift-tools-version: 5.9
// The swift-tools-version declares the minimum version of Swift required to build this package.

import PackageDescription

let package = Package(
    name: "Rainbow",
    dependencies: [
        // Dependencies declare other packages that this package depends on.
        .package(url: "https://github.com/madmachineio/SwiftIO.git", branch: "main"),
        .package(url: "https://github.com/madmachineio/MadBoards.git", branch: "main"),
        .package(url: "https://github.com/madmachineio/MadDrivers.git", branch: "main"),
    ],
    targets: [
        // Targets are the basic building blocks of a package, defining a module or a test suite.
        // Targets can depend on other targets in this package and products from dependencies.
        .executableTarget(
            name: "Rainbow",
            dependencies: [
                "SwiftIO",
                "MadBoards",
                // Use specific library name rather than "MadDrivers" would speed up the build procedure.
                .product(name: "ST7789", package: "MadDrivers"),
            ]),
    ]
)
3. Scroll effect
Create a scroll effect to update the display with rainbow colors in turn.
Project overview
- Fill the screen in red. It will slide in from the left to create an animation.
- Fill the screen with other rainbow colors one by one.
Example code
You can download the project source code here.
- main.swift
- Package.swift
// Create a scroll effect to update the display with rainbow colors in turn.
import SwiftIO
import MadBoard
import ST7789


// Initialize the SPI pin and the digital pins for the LCD.
let bl = DigitalOut(Id.D2)
let rst = DigitalOut(Id.D12)
let dc = DigitalOut(Id.D13)
let cs = DigitalOut(Id.D5)
let spi = SPI(Id.SPI0, speed: 30_000_000)

// Initialize the LCD using the pins above. Rotate the screen to keep the original at the upper left.
let screen = ST7789(spi: spi, cs: cs, dc: dc, rst: rst, bl: bl, rotation: .angle90)

let red: UInt32 = 0xFF0000
let orange: UInt32 = 0xFF7F00
let yellow: UInt32 = 0xFFFF00
let green: UInt32 = 0x00FF00
let blue: UInt32 = 0x0000FF
let indigo: UInt32 = 0x4B0082
let violet: UInt32 = 0x9400D3
let colors888 = [red, orange, yellow, green, blue, indigo, violet]
// Get 16bit color data.
let colors565: [UInt16] = colors888.map { getRGB565BE($0) }

let scrollStep = 5
var buffer = [UInt16](repeating: 0, count: scrollStep * screen.height)

while true {
    // Loop over the colors.
    for color in colors565 {
        // Move left by updating the area with new color.
        for i in 1..<screen.width / scrollStep {
            // Replace all data with current color.
            buffer.indices.forEach { buffer[$0] = color }

            // Send the data to the screen using SPI to update the specified area.
            let x = screen.width - i * scrollStep - 1
            screen.writeBitmap(x: x, y: 0, width: scrollStep, height: screen.height, data: buffer)

            sleep(ms: 30)
        }
    }
}

// The screen needs RGB565 color data, so change color data from UInt32 to UInt16.
// Besides, the board uses little endian format, so the bytes are swapped.
func getRGB565BE(_ color: UInt32) -> UInt16 {
    return UInt16(((color & 0xF80000) >> 8) | ((color & 0xFC00) >> 5) | ((color & 0xF8) >> 3)).byteSwapped
}
// swift-tools-version: 5.9
// The swift-tools-version declares the minimum version of Swift required to build this package.

import PackageDescription

let package = Package(
    name: "ScrollEffect",
    dependencies: [
        // Dependencies declare other packages that this package depends on.
        .package(url: "https://github.com/madmachineio/SwiftIO.git", branch: "main"),
        .package(url: "https://github.com/madmachineio/MadBoards.git", branch: "main"),
        .package(url: "https://github.com/madmachineio/MadDrivers.git", branch: "main"),
    ],
    targets: [
        // Targets are the basic building blocks of a package, defining a module or a test suite.
        // Targets can depend on other targets in this package and products from dependencies.
        .executableTarget(
            name: "ScrollEffect",
            dependencies: [
                "SwiftIO",
                "MadBoards",
                // Use specific library name rather than "MadDrivers" would speed up the build procedure.
                .product(name: "ST7789", package: "MadDrivers"),
            ]),
    ]
)
4. Analog visualizer
Visualize analog values on the screen. The line height changes with the value from the potentiometer.
Project overview
- Read analog value from the potentiometer.
- Map the value to the height of a line to be drawn on the screen.
- Draw a line on the left.
- Draw the next lines one by one. They appear from the left, so the previous lines move to the right.
Example code
You can download the project source code here.
- main.swift
- Package.swift
// Visualize analog values on the screen.
// The line height changes with the value from the potentiometer.

import SwiftIO
import MadBoard
import ST7789


// Initialize the SPI pin and the digital pins for the LCD.
let bl = DigitalOut(Id.D2)
let rst = DigitalOut(Id.D12)
let dc = DigitalOut(Id.D13)
let cs = DigitalOut(Id.D5)
let spi = SPI(Id.SPI0, speed: 30_000_000)

// Initialize the LCD using the pins above. Rotate the screen to keep the original at the upper left.
let screen = ST7789(spi: spi, cs: cs, dc: dc, rst: rst, bl: bl, rotation: .angle90)

// Initialize the analog pin for the potentiometer.
let pot = AnalogIn(Id.A0)

// The max line height drawn on the screen.
let maxHeight = 200

let white: UInt16 = 0xFFFF
let black: UInt16 = 0

// Store the previous heights to make a scrolling display.
var heightValues = [Int](repeating: 0, count: screen.width)

while true {
    // Read current analog value and map it to height.
    let height = pot.readRawValue() * maxHeight / pot.maxRawValue

    // Update line heights for display.
    heightValues.removeFirst()
    heightValues.append(height)

    // Iterate over the array to draw vertical lines with the given height.
    for i in 0..<heightValues.count-1 {
        let lastHeight = heightValues[i]
        let currentHeight = heightValues[i+1]

        // Compare the line heights and update the line.
        if lastHeight > currentHeight {
            drawLine(x: i, y: screen.height - lastHeight, height: lastHeight - currentHeight, color: black)
        } else if lastHeight < currentHeight {
            drawLine(x: i, y: screen.height - currentHeight, height: currentHeight - lastHeight, color: white)
        }
    }

    sleep(ms: 100)
}

// Draw a vertical line on the screen.
func drawLine(x: Int, y: Int, height: Int, color: UInt16) {
    let buffer = [UInt16](repeating: color, count: height)
    screen.writeBitmap(x: x, y: y, width: 1, height: height, data: buffer)
}
// swift-tools-version: 5.9
// The swift-tools-version declares the minimum version of Swift required to build this package.

import PackageDescription

let package = Package(
    name: "AnalogVisualizer",
    dependencies: [
        // Dependencies declare other packages that this package depends on.
        .package(url: "https://github.com/madmachineio/SwiftIO.git", branch: "main"),
        .package(url: "https://github.com/madmachineio/MadBoards.git", branch: "main"),
        .package(url: "https://github.com/madmachineio/MadDrivers.git", branch: "main"),
    ],
    targets: [
        // Targets are the basic building blocks of a package, defining a module or a test suite.
        // Targets can depend on other targets in this package and products from dependencies.
        .executableTarget(
            name: "AnalogVisualizer",
            dependencies: [
                "SwiftIO",
                "MadBoards",
                // Use specific library name rather than "MadDrivers" would speed up the build procedure.
                .product(name: "ST7789", package: "MadDrivers"),
            ]),
    ]
)
5. Acceleration visualizer
This project involves reading accelerations from the accelerometer and drawing three bars with a sliding indicator in the appropriate position to represent the acceleration on the x, y, and z axes.
Project overview
- Draw three bars to represent the acceleration range on the x, y, z-axis.
- Read current accelerations from the accelerometer.
- Map the accelerations to a specific range to fit within the bar range.
- Draw the sliding indicators in the appropriate position to visualize the acceleration change.
Example code
You can download the project source code here.
- main.swift
- Bar.swift
- Package.swift
// Visualize the x, y , z accelerations in the range by moving the corresponding sliders.

import SwiftIO
import MadBoard
import LIS3DH
import ST7789


// Initialize the SPI pin and the digital pins for the LCD.
let bl = DigitalOut(Id.D2)
let rst = DigitalOut(Id.D12)
let dc = DigitalOut(Id.D13)
let cs = DigitalOut(Id.D5)
let spi = SPI(Id.SPI0, speed: 30_000_000)
// Initialize the LCD using the pins above. Rotate the screen to keep the original at the upper left.
let screen = ST7789(spi: spi, cs: cs, dc: dc, rst: rst, bl: bl, rotation: .angle90)

// Initialize the accelerometer using I2C communication.
let i2c = I2C (Id.I2C0)
let accelerometer = LIS3DH(i2c)

// 16-bit colors for acceleration bars.
let red: UInt16 = 0x07E0
let green: UInt16 = 0x001F
let blue: UInt16 = 0xF800

// Get the acceleration range of the sensor.
let gRange: Int
switch accelerometer.getRange() {
case .g2: gRange = 4
case .g4: gRange = 8
case .g8: gRange = 16
case .g16: gRange = 32
}

// Draw the bars of accelerations on x, y, z-axis.
let barWidth = 200
let barHeight = 40
let spacer = 20
let startY = (screen.height - barHeight * 3 - spacer * 2) / 2

var xBar = Bar(y: startY, width: barWidth, height: barHeight, color: red, screen: screen)
var yBar = Bar(y: startY + barHeight + spacer, width: barWidth, height: barHeight, color: green, screen: screen)
var zBar = Bar(y: startY + (barHeight + spacer) * 2, width: barWidth, height: barHeight, color: blue, screen: screen)

while true {
    // Update the indicators' position in each bar according to the current accelerations.
    let values = accelerometer.readXYZ()
    xBar.update(values.x, gRange: gRange)
    yBar.update(values.y, gRange: gRange)
    zBar.update(values.z, gRange: gRange)
    sleep(ms: 10)
}
import ST7789

struct Bar {
    let x: Int
    let y: Int
    let width: Int
    let height: Int
    let screen: ST7789
    let color: UInt16

    var indicatorPos: Int?
    let indicatorColor: UInt16 = 0xFFFF

    // Draw a bar on the screen.
    init(y: Int, width: Int, height: Int, color: UInt16, screen: ST7789) {
        self.y = y
        self.width = width
        self.height = height
        self.color = color
        self.screen = screen
        x = (screen.width - width) / 2

        let data = [UInt16](repeating: color, count: width * height)
        screen.writeBitmap(x: x, y: y, width: width, height: height, data: data)
    }

    // Update indicator's position in the bar with the latest value.
    mutating func update(_ accel: Float, gRange: Int) {
        let currentPos = x + Int((accel + 2) * Float((width - 1) / gRange))

        if indicatorPos != currentPos {
            // Draw the indicator at its current position.
            for py in y..<y+height {
                screen.writePixel(x: currentPos, y: py, color: indicatorColor)
            }

            if let indicatorPos {
                // Remove the indicator from its previous position.
                for py in y..<y+height {
                    screen.writePixel(x: indicatorPos, y: py, color: color)
                }
            }

            indicatorPos = currentPos
        }
    }
}
// swift-tools-version: 5.9
// The swift-tools-version declares the minimum version of Swift required to build this package.

import PackageDescription

let package = Package(
    name: "AccelerationVisualizer",
    dependencies: [
        // Dependencies declare other packages that this package depends on.
        .package(url: "https://github.com/madmachineio/SwiftIO.git", branch: "main"),
        .package(url: "https://github.com/madmachineio/MadBoards.git", branch: "main"),
        .package(url: "https://github.com/madmachineio/MadDrivers.git", branch: "main"),
    ],
    targets: [
        // Targets are the basic building blocks of a package, defining a module or a test suite.
        // Targets can depend on other targets in this package and products from dependencies.
        .executableTarget(
            name: "AccelerationVisualizer",
            dependencies: [
                "SwiftIO",
                "MadBoards",
                // Use specific library name rather than "MadDrivers" would speed up the build procedure.
                .product(name: "LIS3DH", package: "MadDrivers"),
                .product(name: "ST7789", package: "MadDrivers"),
            ]),
    ]
)
🔸API
SPI
This class is used to send and receive data using SPI protocol.
init(_ idName: IdName, speed: Int = 5_000_000, csPin: DigitalOut? = nil, CPOL: Bool = false, CPHA: Bool = false, bitOrder: BitOrder = .MSB)
Initialize an SPI interface.
Parameter:
idName: spi pin id that the device connects to.speed: the communication speed, 5MHz by default.csPin: aDigitalOutpin as a CS pin. It is nil by default. If you don't set it, you need to control it manually when communicating with devices.CPOL: the state of clock signal when it's idle,falseby default.CPHA: the edge of clock signal to sample data, false for first edge and true for second edge.falseby default.bitOrder: the bit order during data transmission,.MSBby default.
ST7789
It configures the LCD and allows you to draw pixels on it.
init(spi: SPI, cs: DigitalOut, dc: DigitalOut, rst: DigitalOut, bl: DigitalOut, width: Int = 240, height: Int = 240, rotation: Rotation = .angle0)
Initialize an LCD.
Parameter:
spi: the SPI interface that the LCD connects to.cs: the cs pin for SPI communication. The cs pin is controlled in this class, so thecsPininSPIclass should be nil.dc: aDigitalOutpin used for data and command selection.rst: aDigitalOutpin used to reset the LCD.bl: aDigitalOutpin used for backlight control.width: the width of the LCD, 240 by default.height: the height of the LCD, 240 by default.rotation: the degree of LCD rotation,.angle0by default. It is used to set the position of origin.
func writeBitmap(x: Int, y: Int, width w: Int, height h: Int, data: [UInt16])
Fill a block of pixels on the screen.
Parameter:
x,y: the coordinate of the starting point, that is, the left upper corner of the area.width: the width of the area.height: the height of the area.data: the color data stored in an UInt16 array.
func writePixel(x: Int, y: Int, color: UInt16)
Draw a single pixel.
It's actually a bitmap whose height and width are 1px. So it needs only one 16-bit color data. If you want to display whatever graphic, like a circle, rectangle, triangle, etc, it is just about the calculation of the coordinates of necessary pixels.
Parameter:
x,y: the coordinate of the pixel.color: a UInt16 color value.
func clearScreen(_ color: UInt16 = 0x0000)
Fill the whole screen with one color. It sets the bitmap to screen size and needs a UInt16 color value to fill all pixels with the same color.
Parameter:
color: a color data in UInt16.
🔸Background
What is SPI?
In the previous tutorials, you tried I2C communication and should have a basic understanding of communication protocols. Communication protocols enable MCUs to communicate with other devices more easily and efficiently by providing a standardized method for exchanging data. Besides I2C, SPI is also commonly used in embedded systems for MCUs to interact with other devices.
Serial Peripheral Interface, SPI for short, is another synchronous communication protocol between devices. It also supports one master with multiple devices, but its speed is much faster than I2C.
❖ SPI bus
The SPI bus normally consists of four signal lines:
- SCK (serial clock): it carries the clock signal generated by the master device to ensure synchronous data transmission.
- SDI (serial data in): also called MISO (master in slave out). The master device receives data from slave devices through this line.
- SDO (serial data out): also called MOSI (master out slave in). The master device sends data to slave devices through this line.
- CS (chip select): master device controls this signal to select the specified slave device. Each slave device needs a CS that connects to the master.
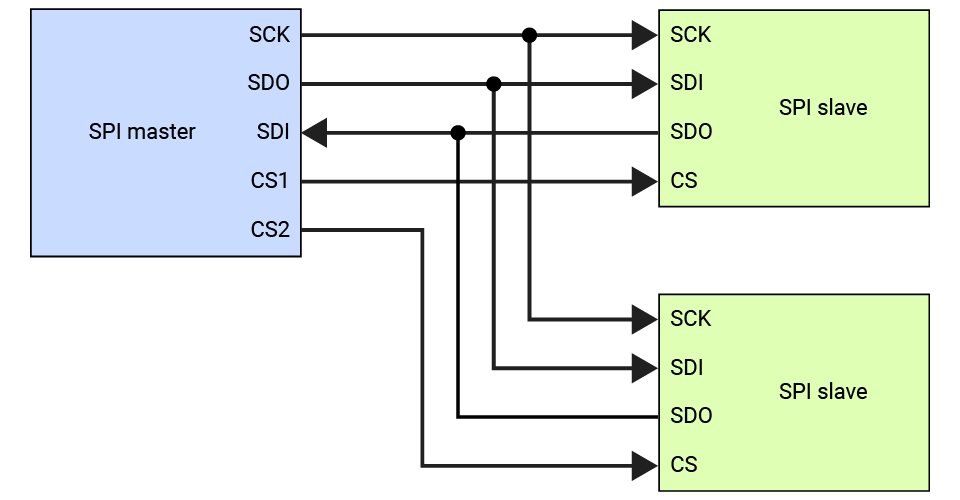
❖ Device selection
The CS line allows multiple slave devices to be connected to the same SPI bus, with each device being assigned a unique CS line. In most cases, it is connected to a GPIO pin on the MCU. This allows the master device to control the CS line by toggling the pin.
At the beginning of an SPI communication, the master device will set the CS line of the desired slave device to a low state. This indicates slave device has been selected for communication and allows the master device to communicate with that device independently.
Once the communication is complete, the master device returns the CS line to the high state to deselect the slave device. This frees up the SPI bus for other communication, and allows the slave device to return to its idle state.
❖ Data transmission
SPI typically uses a full-duplex communication method, which means that data can be transmitted and received simultaneously. The master device sends a clock signal on the SCK line for synchronizing data transfer, and on each clock pulse, data is shifted in or out of the two data lines.
This allows for faster transfer of data compared to I2C, which uses a half-duplex communication method that requires the devices to take turns transmitting and receiving data on a single line.
The bit order is an important factor to consider when using the SPI protocol. It refers to the order in which the bits of each byte are transmitted over the bus: MSB (most significant bit) first and LSB (least significant bit) first.
For example, for a byte 0b10101010, if in MSB first mode, it would be transmitted as follows: 1, 0, 1, 0, 1, 0, 1, 0, while in LSB first mode, it would be 0, 1, 0, 1, 0, 1, 0, 1.
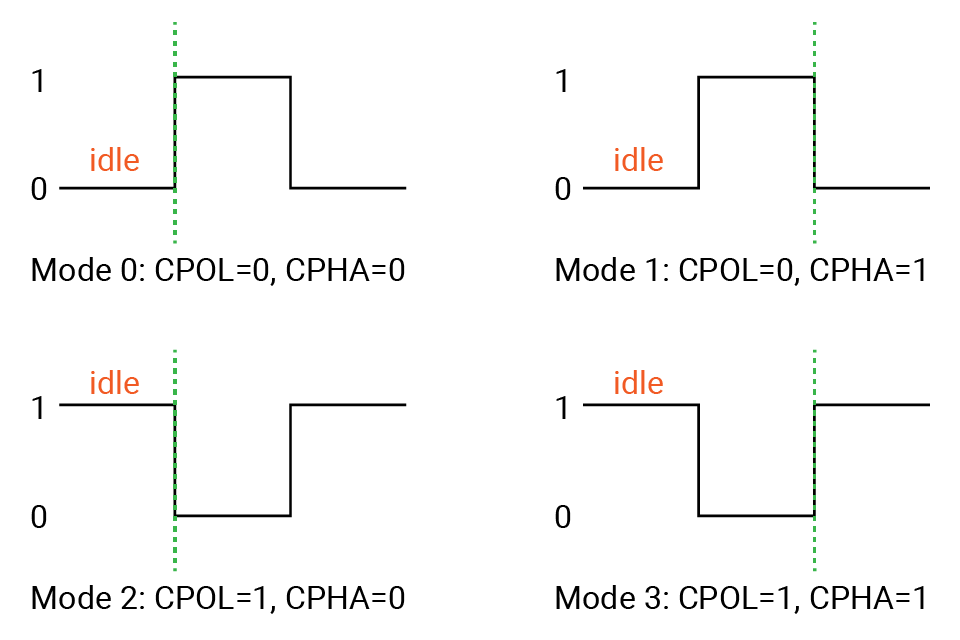
❖ SPI mode
SPI supports four different modes (0-3) of operation, which are determined by the polarity and phase of the clock signal. Its mode determines the timing and order in which data is transmitted and received between the master and slave devices.
- CPOL (clock polarity): it depends on the state of SCK when the line is idle. 1 for high and 0 for low.
- CPHA (clock phase): it describes the sampling phase relative to the clock signal. If the data is sampled at the first edge of the clock pulse, it is 0. If it's sampled at the second edge, it's 1.
For more details on SPI, you could look at this article.
Peripheral - SPI
Many MCUs come with built-in SPI peripherals for SPI communication, which makes it easy to interface with other SPI devices.
These peripherals typically include registers that control the various aspects of SPI communication, such as the clock speed, data transfer format, and CS line configuration. To use the SPI peripheral on an MCU, you actually configure the related SPI registers.
When programming MCUs to interact with SPI devices, you usually don't need to worry about the low-level details of SPI communication. The SwiftIO library abstracts away the low-level details of SPI communication and provides APIs to perform SPI communication. These APIs typically include functions to initialize and configure the SPI peripheral, as well as send and receive data using the SPI.
To connect an SPI device to MCUs, you will need to connect the MOSI (SDO), MISO (SDI), and SCK pins on MCUs to the corresponding pins on the device.
Additionally, the CS (Chip Select) pin of the SPI device should be connected to a GPIO pin on the MCU, which allows the MCU to control the CS line and select the desired SPI device for communication. The specific GPIO pin used for the CS pin can be configured in the SPI library or driver code.
| MCU | SPI device |
|---|---|
| MOSI (SDO) | MOSI (SDI) |
| MISO (SDI) | MISO (SDO) |
| SCK | SCK |
| a GPIO pin | CS |
🔸New component
LCD
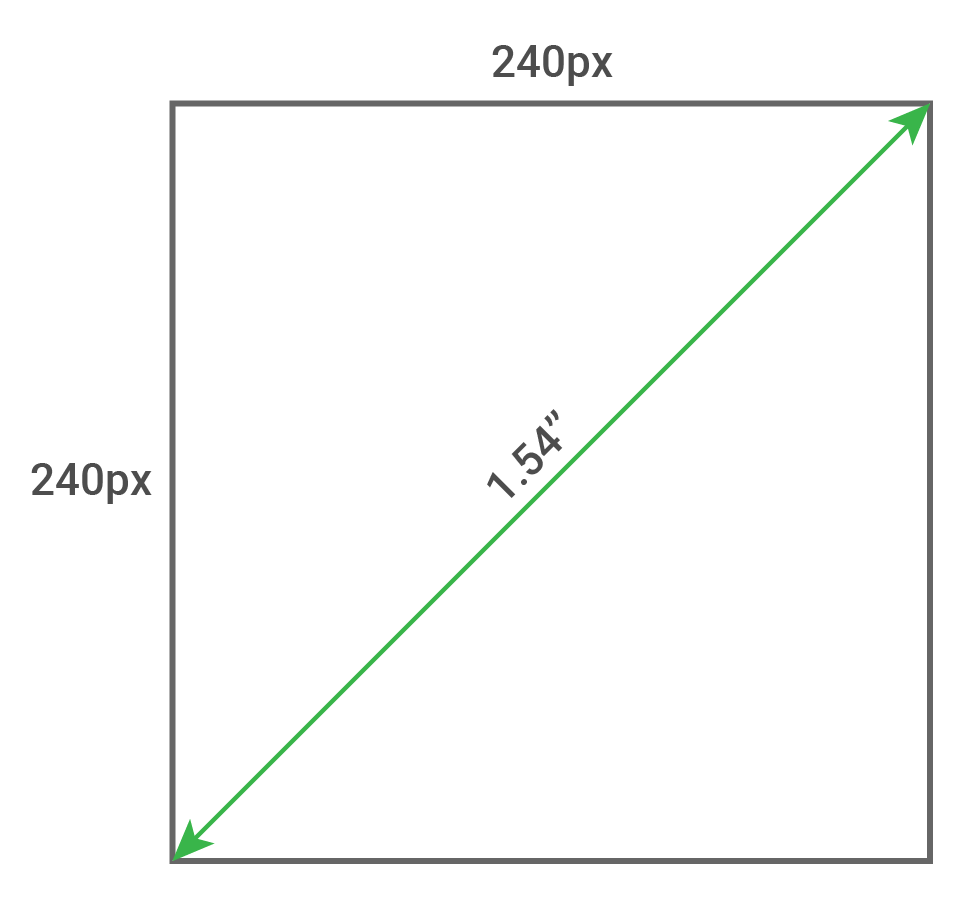
There are so many kinds of screens to display characters or graphics. The one you are going to use is a TFT LCD screen (Thin-film-transistor liquid crystal display). It can provide good viewing angles and a high-quality viewing experience in many cases.
The size of an LCD screen is typically measured diagonally from one corner to the opposite corner. This 1.54-inch ST7789 display on your kit has a resolution of 240x240 pixels.
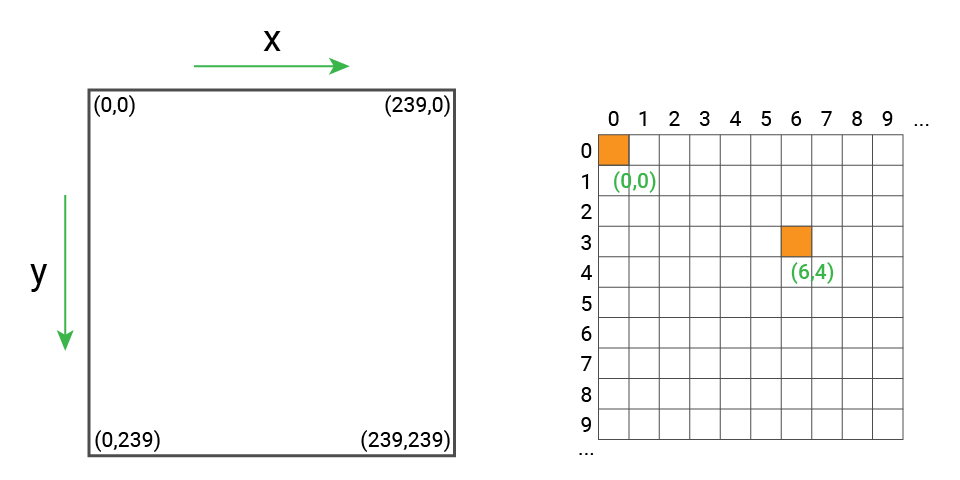
One pixel is the smallest unit of display on an LCD screen. Each pixel displays a specific color, and when combined with other pixels, forms a complete image on the screen. The number of pixels on a screen is often referred to as the screen resolution, and it is typically expressed as the number of pixels in width and height. For example, a screen with a resolution of 240x240 has 240 pixels horizontally and 240 pixels vertically, for a total of 57600 pixels on the screen.
Pixels are arranged in a grid on the screen, with each pixel having its own unique coordinates based on its position in the grid, like (0,0), (6,4) in the image below. The origin (0,0) is in the upper-left corner. The x-axis is the horizontal axis, and it runs from left to right. The y-axis is the vertical axis, and it runs from top to bottom. So all pixels for this LCD are from (0,0) to (239,239).
The color of each pixel on this LCD screen is determined by the combination of red, green, and blue intensities. The intensity of each color channel is typically represented by a numeric value, such as an 8-bit value ranging from 0 to 255, where 0 represents the absence of the color and 255 represents the maximum intensity of the color. By varying the values in each color channel, different colors can be displayed on the screen.
To display an image or graphic on the screen, the microcontroller must first determine the pixel data for each pixel, including its coordinates and the color data. This pixel data is then transmitted to the ST7789 LCD screen over the SPI wires.
Once the screen receives the pixel data, it uses its internal circuitry to display the image or graphic on the screen. The speed and efficiency of the data transfer and display circuitry can have a significant impact on the overall performance and image quality of the display.
🔸New concept
RGB color model
RGB color model is a common way to describe colors in many displays, for example, on your computer monitor.
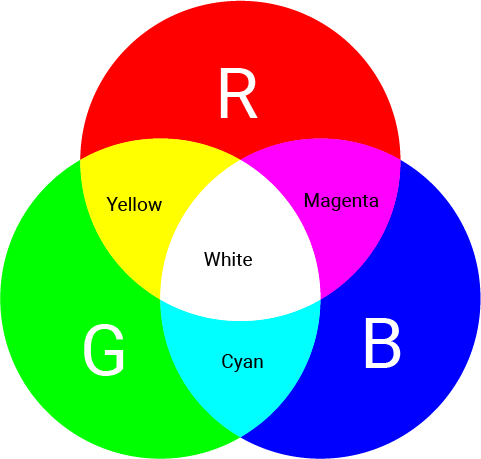
RGB represents red, green, and blue. They are the basis of colors. The combination of three colors forms more colors: red and green form yellow, green and blue form cyan, blue and red form magenta, the combination of rgb colors form white. By mixing three colors with different intensities, you will get a broad range of colors.
Color depth
Color depth, or bit depth, describes the number of bits to represent a pixel on the screen. It tells the count of colors that each pixel can display. For each bit, there are two values: 0 or 1. So you could easily get the total number of colors: 2 to the power of the number of bits. A 1-bit color depth has only two colors, such as white and black.
The color depth you will always see nowadays is 16-bit, 24-bit, and 32 bit.
- For 16-bit color, also called high color, there are 65536 colors in total. The values are divided into 5, 6, 5 bits, representing red, green, and blue.
- 24-bit color is called true color. There are about 16 million colors. The bits are evenly divided to represent RGB colors: 8 for red, 8 for green, and 8 for blue.
- 32-bit color, quite like 24-bit color, uses 8-bit for red, 8-bit for green, and 8-bit for blue. Besides, there is an 8-bit alpha channel to represent the degree of transparency.
The color code normally represents colors as a combination of red, green, and blue values. Each color channel is represented by an 8-bit value, which means it can take on 256 different values (2^8).

- For example, the color white is represented as 0xFFFFFF in hexadecimal because it has the maximum value (255) for each of the three color channels.
- Black is represented as 0x000000 and has a value of 0 for all three color channels.
- Red is represented as 0xFF0000 because it has the maximum value for the red channel, and 0 for the green and blue channels, resulting in pure red.
However, the LCD module in this kit supports 16-bit color. So if you are going to define the color for this screen, you need to convert 24-bit color to 16-bit color. Usually, you will take the bits of each color from the most significant bits as below, because they have more effect on the color. So red is represented as 0xF800. You could use the online converters to get 16-bit color values from 24-bit.

Image format
When you scale up images several times, you may notice some of the images are just the same and don't lose any quality. These images are called vector images. They use points and lines to create paths based on mathematical formulas. The fonts used on all websites now are usually in vector format. It will never be blurry as you zoom it in.
While for other images, multiple grids begin to appear as they are zoomed in to a certain degree. These images are called raster images, also known as bitmaps. The whole image is a combination of the smallest units called pixels. More pixels of the same size means the image is of higher quality.

In this tutorial, the stuff displayed on the LCD are all raster graphics. There are two commonly used file formats of bitmap.
- BMP stands for bitmap. BMP image is uncompressed and stores the color data of all pixels. Therefore it usually has a large file size.
- JPG file uses compression algorithms to deal with similar pixels to reduce the file size. So it needs to be decoded as you open the file. It is a widely used format, so the image viewers on your computer can open it successfully.